Frequently Asked Questions
What are diagnostic terms?
The terms refer to the clinical codes of the International Classification of Diseases, Tenth Revision (ICD-10) that categorizes diagnostic terms under "chapters" corresponding to the major organ systems, such as “Diseases of the circulatory system”, or key disease classes, such as “Neoplasms”.
Note that the ICD-10 ontology is not intended to reflect biological processes, though nevertheless captures many important relationships between related disorders, subtypes and complications.
What are HES and SRS?
The UK Biobank contains two sources of phenotypic data where disease outcomes can be ascertain. The first, referred to as HES, is derived from linkage with the hospital episode statistics registry (UK Biobank data fields 41142 and 41078). The second, referred to as SRS, is ascertained through the completion of questionnaires and interviews with study participants (data field 20002 non-cancer illness code, self-reported statistics). Disease outcomes in both data sets are coded using different disease classification schemes, the former ()HES uses the ICD-10 and the latter a classification scheme proposed by the UK Biobank.
What are variant clusters?
Distinct and unlinked SNPs may have similar patterns of risk and protection across the phenotypes analysed. We used a hierarchical clustering approach to define relationships among variants and to group variants into separate clusters. For each cluster of SNPs we then obtain a risk and protection profile. See our manuscript for detailed explanation of how relationship between variants is calculated.
What does p(effect) mean?
The TreeWAS method infers the posterior probability of a variant to have any effect on a given disease classification code (i.e. diagnostic term). Three effects are considered; risk, protective, and no effect, where the sum of posterior probabilities is p(risk) + p(protective) + p(no effect) = 1. Here, we define p(effect) = 1 - p(no effect) to distinguish any effect (risk or protective) from no effect.
How to interpret the hierarchical visualisation?
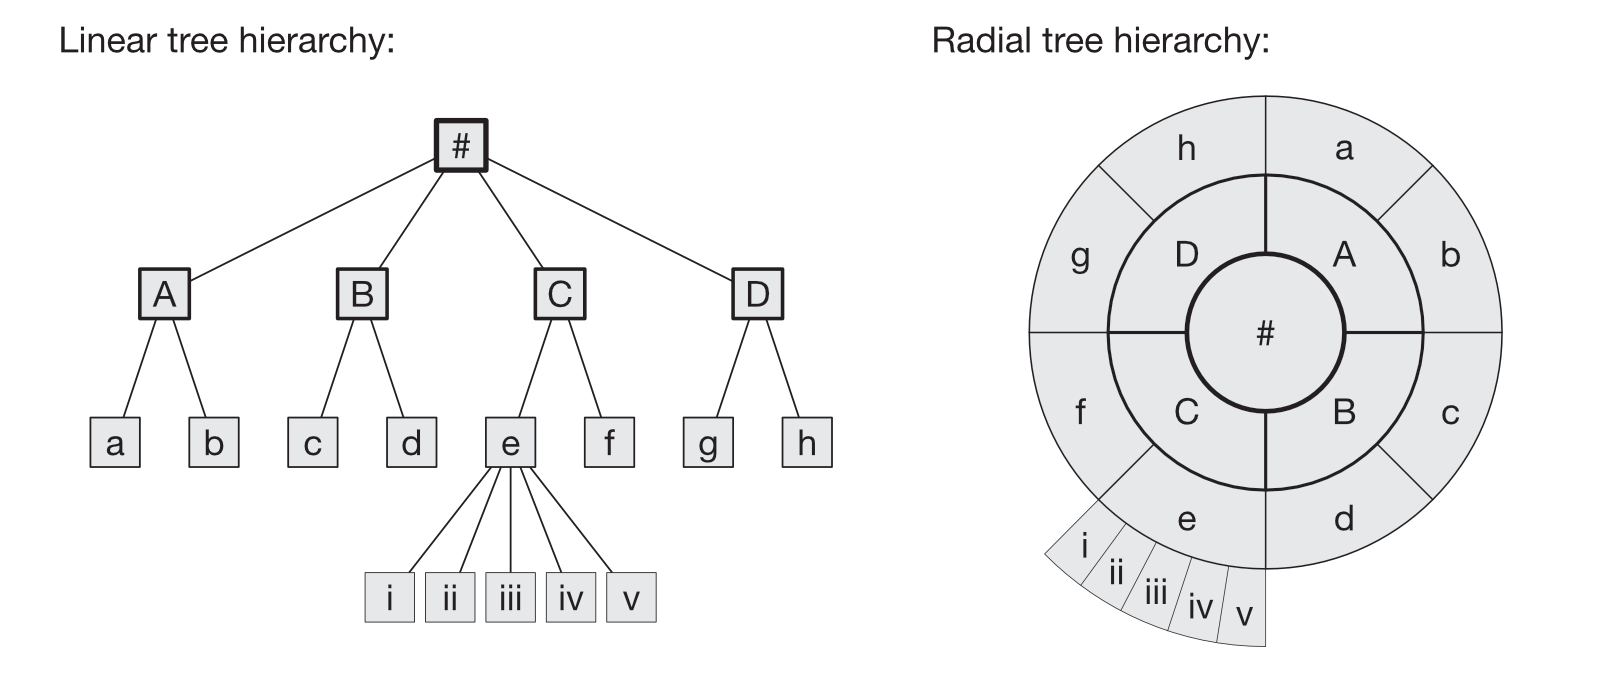
The figure shows a tree structure, but in which nodes are arranged in a radial shape; see figure below to compare the common "linear" structure (left) to its radial visualisation (right). Every genetic variant contained in the TreeWAS Database has been analysed to infer its association with a given diagnostic term. These terms are structured hierarchically, where a given term (clinical code) is nested within a broader disease/disorder category. Here, this tree structure is displayed with the "top node" or "root" as a circle in the middle; nested terms subtend from the root or their parent terms outwards.
Additional information about every node is shown when hovering your cursor over a given node; the clinical code and description are shown, as well as the inferred posterior probabilities for the current variant (or variant cluster) associated with a given term.
Each node is coloured according to its dominant effect; protective (blue), risk (red), or no effect (gray) posterior probability, computed as Δp = p(protective) - p(risk); see legend.
Note that the size or area covered by a node has no relation to the inferred effect or posterior probability. Node sizes are adjusted to maintain consistent placing across all variant or variant cluster figures.
Filtering. By default, the hierarchicial visualisation only displays nodes that convey relevant protective or risk effects. Nodes are not shown if the posterior probability of "no effect" is dominant; i.e. if p(effect) > 0.1. However, a node with "no effect" will be shown if it is a parent to a term that conveys an effect, so as to maintain an unbroken hierarchical tree structure. This is done to reduce the impact on server-side computation times and user-side loading times, as not all browsers or computer systems have sufficient capabilities to display large, complex structures that are dynamically rendered on the browser viewport. You can adjust filtering by changing the threshold value. Note that the top node and the "chapter" nodes are never filtered.
Node arrangement.The filtering function described above is useful to reduce rendering times and impact on the browser. However, it may still be difficult to see and select relevant nodes within the tree structure. By default, an "absolute" node arrangement is displayed, where node positions are consistent across all visualisations for different components. By contrast, the "relative" node arrangement equalises the distances between the nodes displayed to maximise the space occupied by each node. Note that this viewing option is only available if filtering is applied.
Zooming. You can "zoom" the tree by clicking on a node in the tree displayed. The figure is then reloaded and nodes are displayed in a semi-radial shape, with the selected node as the new "root" of the tree. Note that the zooming function is disabled for the "top node" and any terminal node. No filtering is applied when using the zoom.
How are the figures generated?
Every figure displayed on this website is dynamically generated in your browser using the data fetched for a given component from the TreeWAS Database. The underlying plotting library is Vega v4.4, which is build on D3 (Data-Driven Documents).
If you encounter problems with the visualisation of any figure, please try again using another browser. Most modern browsers (e.g. Chrome, Safari, Firefox, Opera, etc) should be able to correctly display any of the figures by default. Note that JavaScript must be enabled in your browser.
How to download figures?
Every figure displayed on this website is dynamically generated in your browser and can be downloaded in PNG format.
Most modern browsers (e.g. Chrome, Safari, Firefox, Opera, etc) should be able to correctly display and download any figure. However, some browsers may show errors when attempting to download a figure, due to the large number of visual components that need to be converted into a downloadable graphical format. For example, Chrome is known to block such requests if the number of components exceeds a certain threshold, resulting in a "network error". If you encounter problems with PNG downloads, please try again using another browser. Note that JavaScript must be enabled in your browser.
How to download data?
A download button is displayed on every page that shows the results for a given variant, a variant cluster, or a heath-related term.
By clicking on the download button, a file is dynamically generated for the currently viewed component, which should start the download automatically.
This file will be downloaded and locally stored on your computer under the filename displayed next to the download button.
By default, all data files are generated in common CSV format.
The option to download the entire TreeWAS Database at once is not provided.
If you encounter problems with the downloading function, please try again using another browser. Note that you do not need to have JavaScript enabled to download data.
When using the Safari browser, file downloads work just fine, but the Safari console emits an error, which is a known issue in Safari.
The TreeWAS Database is the result of research conducted at the Oxford Big Data Institute at the University of Oxford.
This research has been conducted using the UK Biobank Resource (application number 10625). This work uses data provided by patients and collected by the NHS as part of their care and support.
This research has been conducted with the support of the Wellcome Trust (100956/Z/13/Z and 090532/Z/09/Z and 100308/Z/12/Z), the Danish National Research Foundation, Takeda, the Medical Research Council (MC_UU_12010/3), the Oak Foundation (OCAY-15-520), the National Institute for Health Research (NIHR) Oxford Biomedical Research Centre (BRC), the Wellcome Trust/Royal Society (204290/Z/16/Z) and the Li Ka Shing Foundation.
This website was created, designed, and edited by
 Patrick K. Albers
The contents of TreeWAS.org are available under the Creative Commons Attribution 4.0 International License (CC BY 4.0) with attribution (citation) required.
TreeWAS Database © 2019 - 2026 About Frequently Asked Questions Citation Contact Terms & Conditions